How water moves around Sunwake
Computational fluid dynamics (CFD) tests how the two hulls make waves, settle into a running attitude, and resist motion. This completed fine-grid case covers one condition: bare hulls at 8.15 kn in calm water. It provides evidence for the next design decision, not a final powering number.
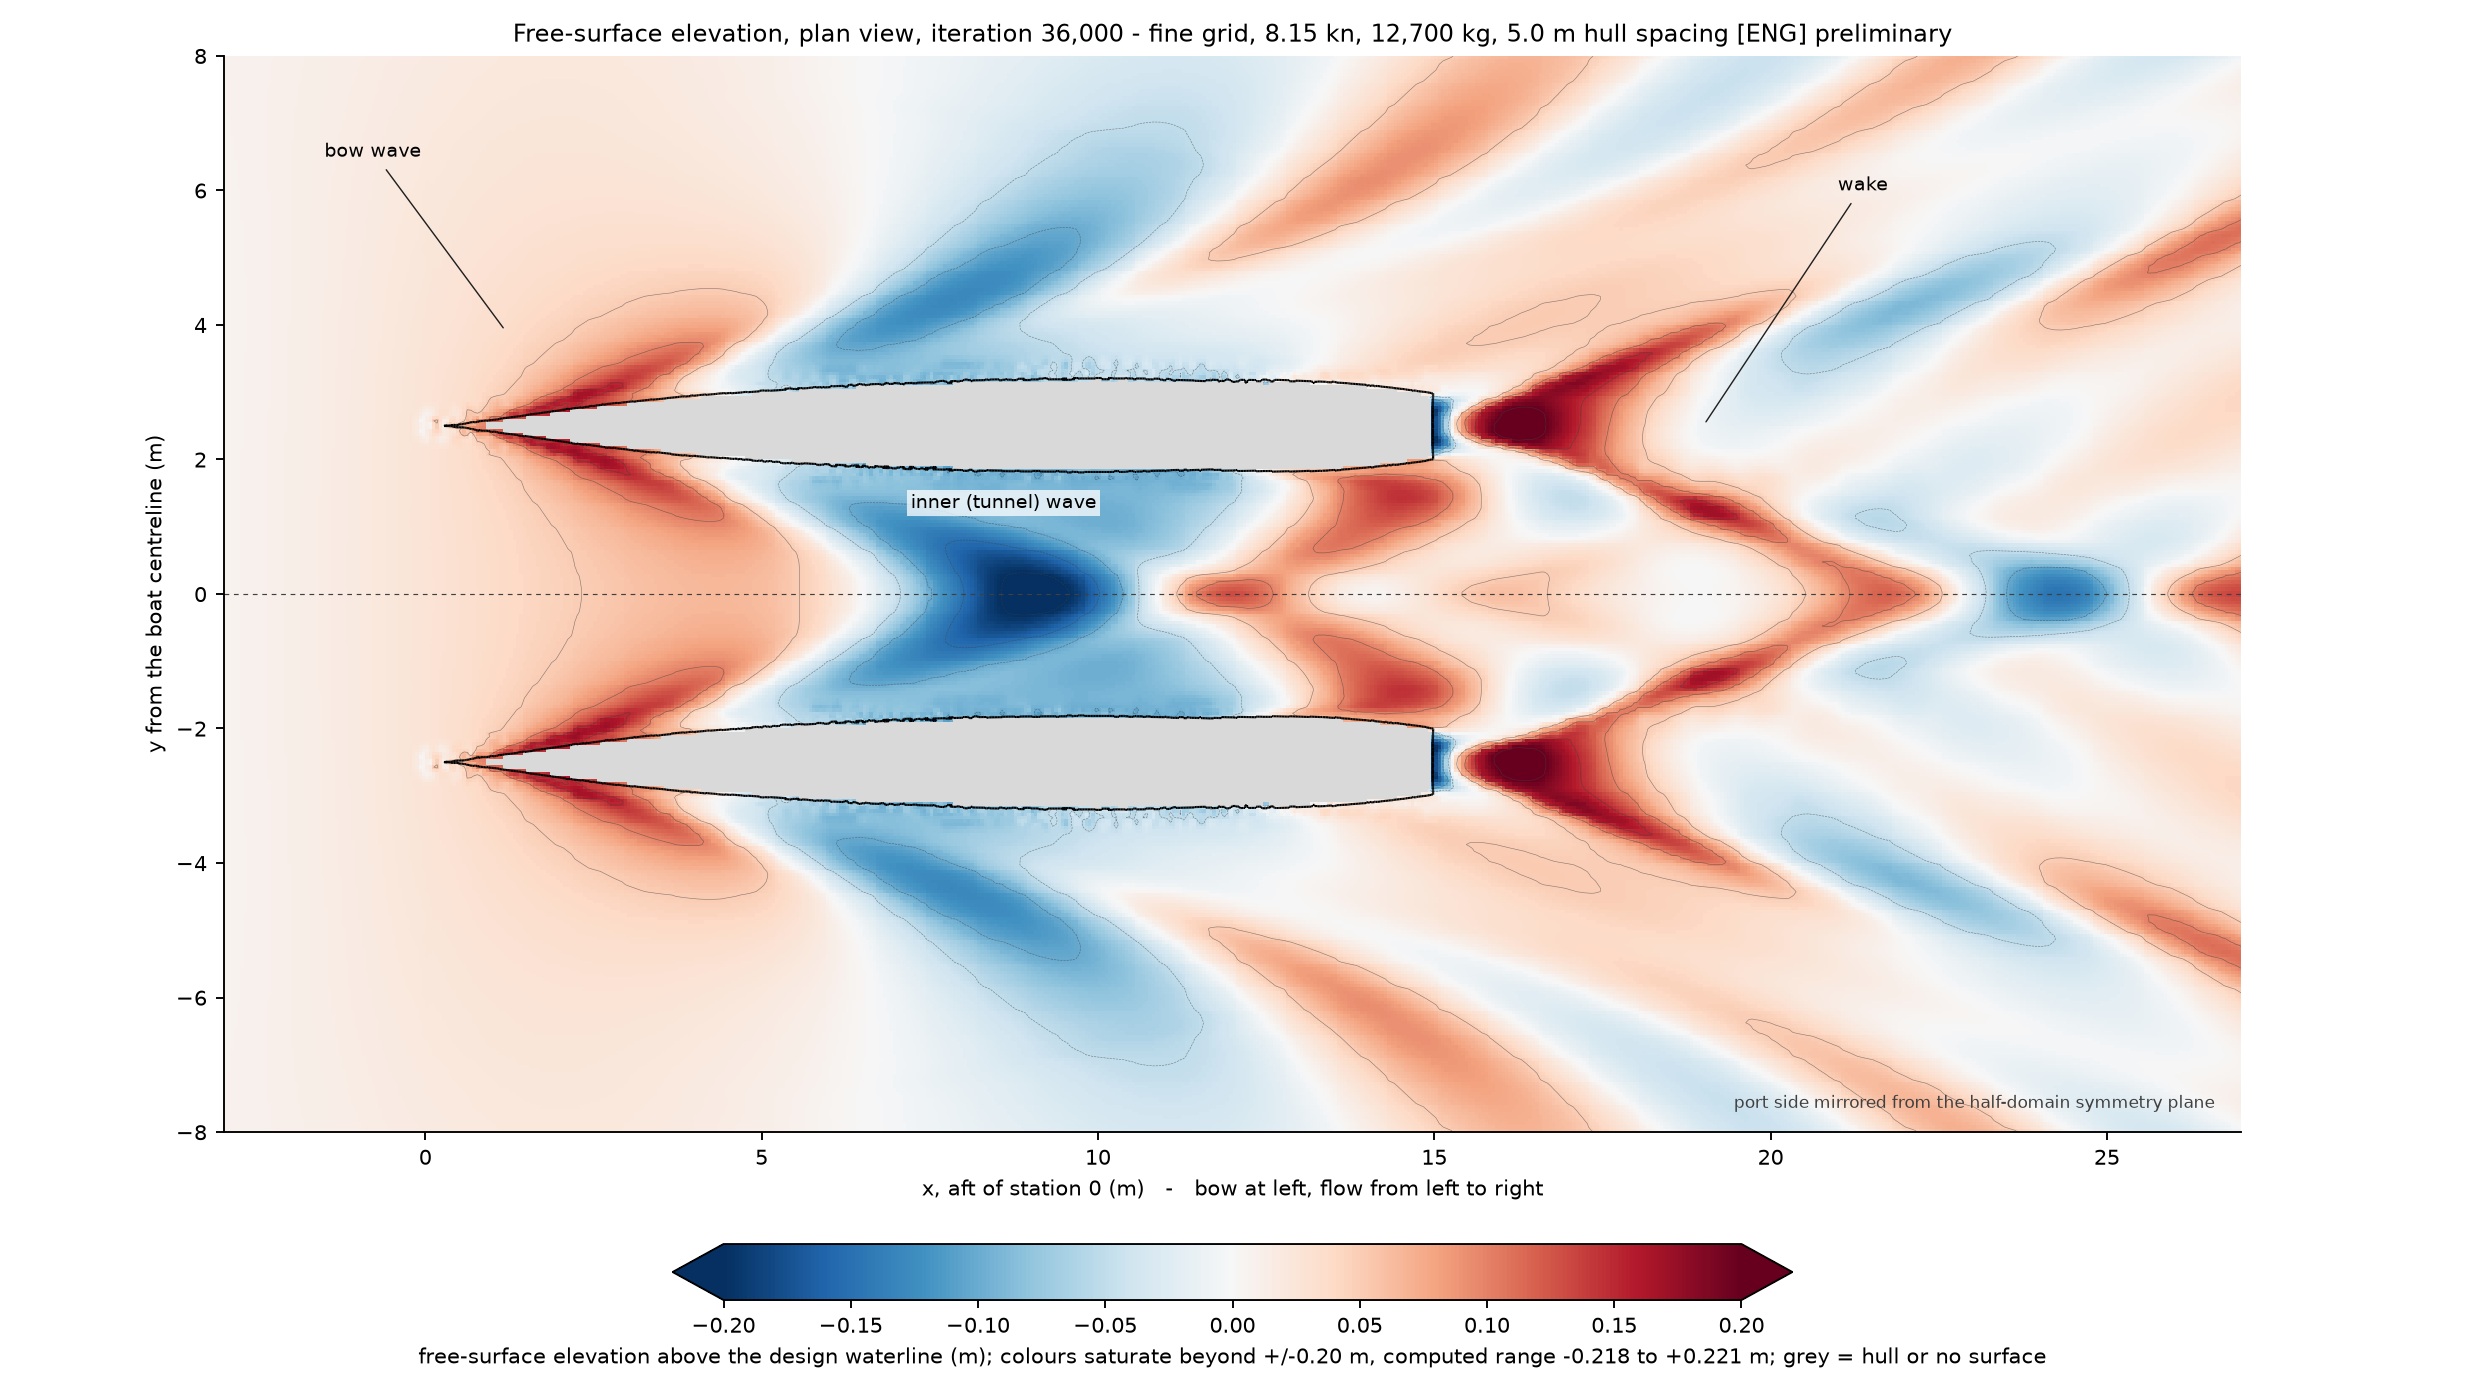
The question this work answers
Sunwake's hulls sit 5.0 m apart, or one third of the 15.0 m waterline length. The earlier analytical wave-resistance model predicts that their wave systems partly cancel at 7.0–7.5 kn and reinforce at 8.5–9.0 kn. That result affects passage speed, energy use, and hull spacing, so the CFD campaign tests it before the lines freeze.
A stable result at one speed
The 8.15 kn case produced a coherent wave field, stable force averages, and a bounded running attitude on the fine grid.
A comparative speed and spacing sweep
One operating point cannot confirm the predicted cancellation and reinforcement. The production sweep remains open.
The resistance settles into a narrow band
The chart uses the preserved solver history. Move the slider to inspect the whole-boat pressure and viscous forces at 200-iteration intervals. The shaded region marks the accepted averaging window from 28,800 to 36,000 solver iterations. The dashed line marks its 1,885 N total mean.
Fine-grid force convergence
The averaging window, not the last sample, produces the reported result: 978.4 N of pressure resistance plus 906.8 N of viscous resistance equals 1,885.2 N total. The medium grid at its own running attitude produced 1,798.5 N. The fine-grid result is 4.82% higher, which shows that mesh choice still matters.
Watch the wave pattern settle
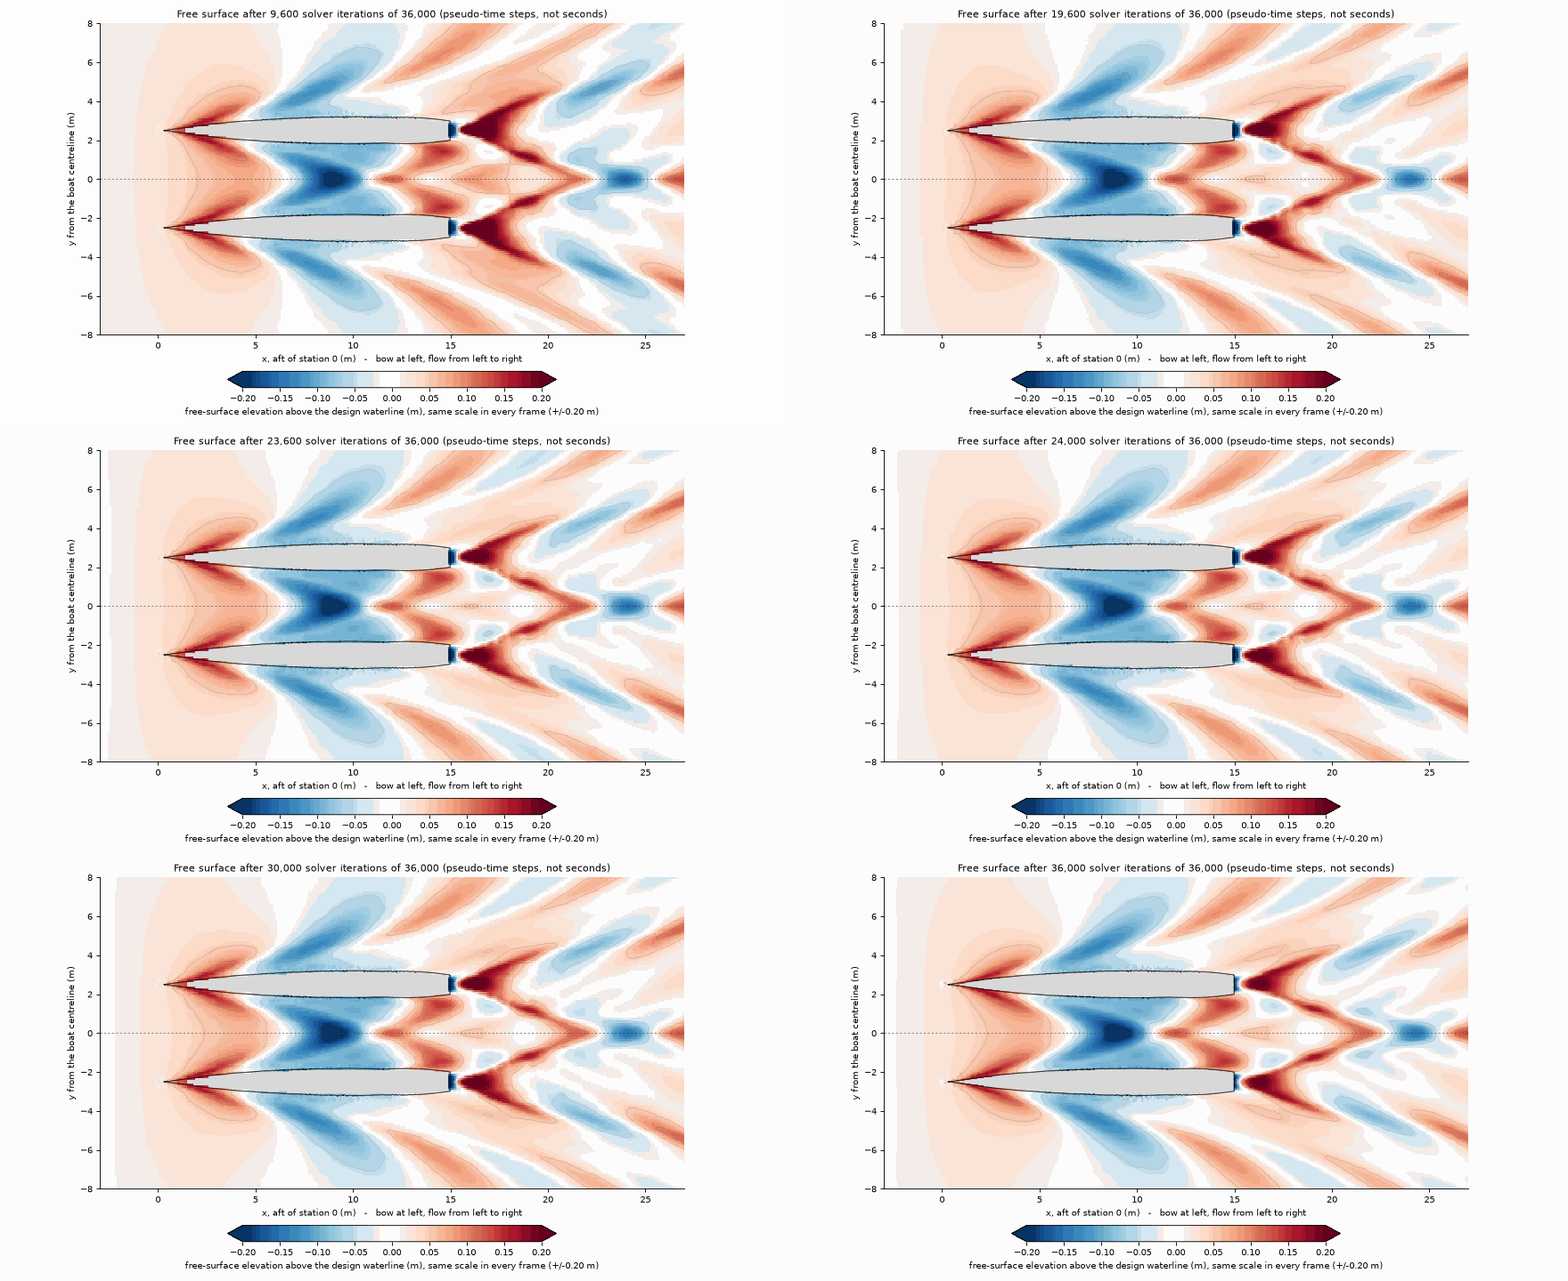
The bow waves and the inner-hull wave become stable before the accepted force window begins. The smooth pattern and the lack of reflected waves at the domain edges support the force result. They do not validate its absolute value.
Pressure explains the running attitude
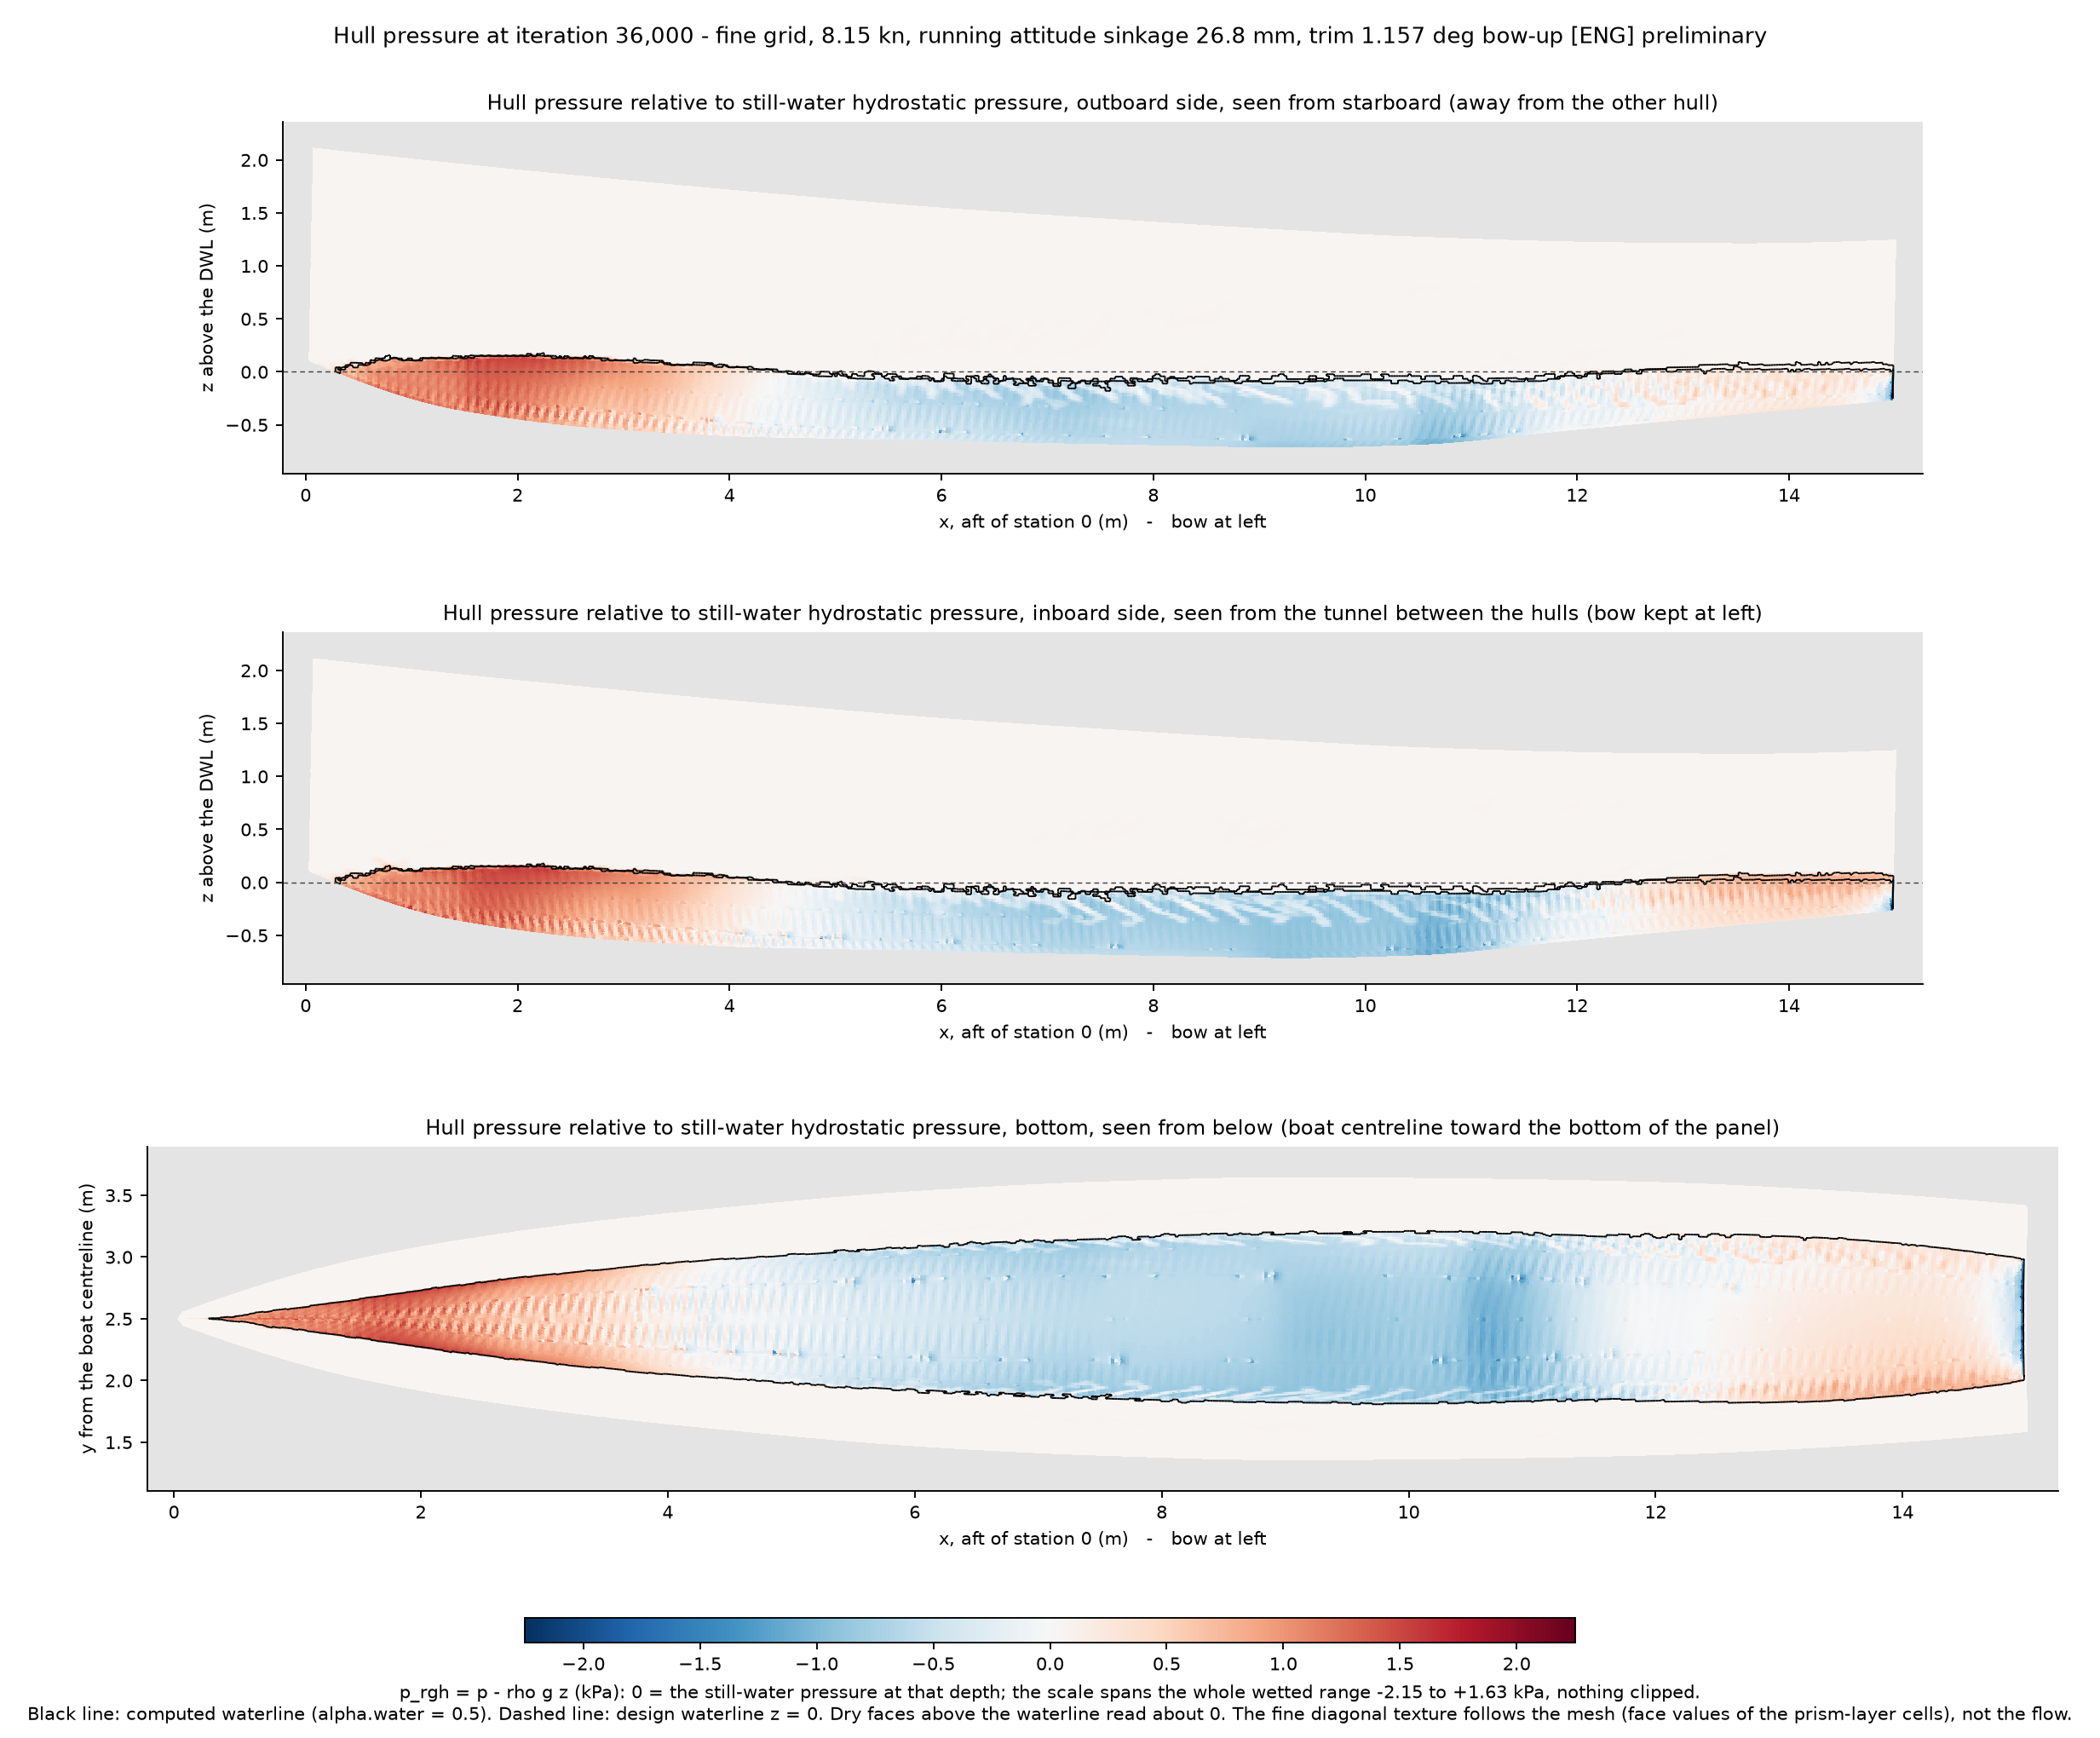
The bow pushes; the shoulder pulls
The red patch at the stem shows the bow pushing water aside. The blue band along the forward shoulder shows lower pressure pulling the hull down. That pressure pattern produces the calculated 26.8 mm sinkage and 1.157° bow-up trim.
The pressure drag in the force chart is the fore-and-aft imbalance of this field. The displayed scale covers the full wetted range from -2.15 kPa to +1.63 kPa, so the image clips no wetted pressure value.
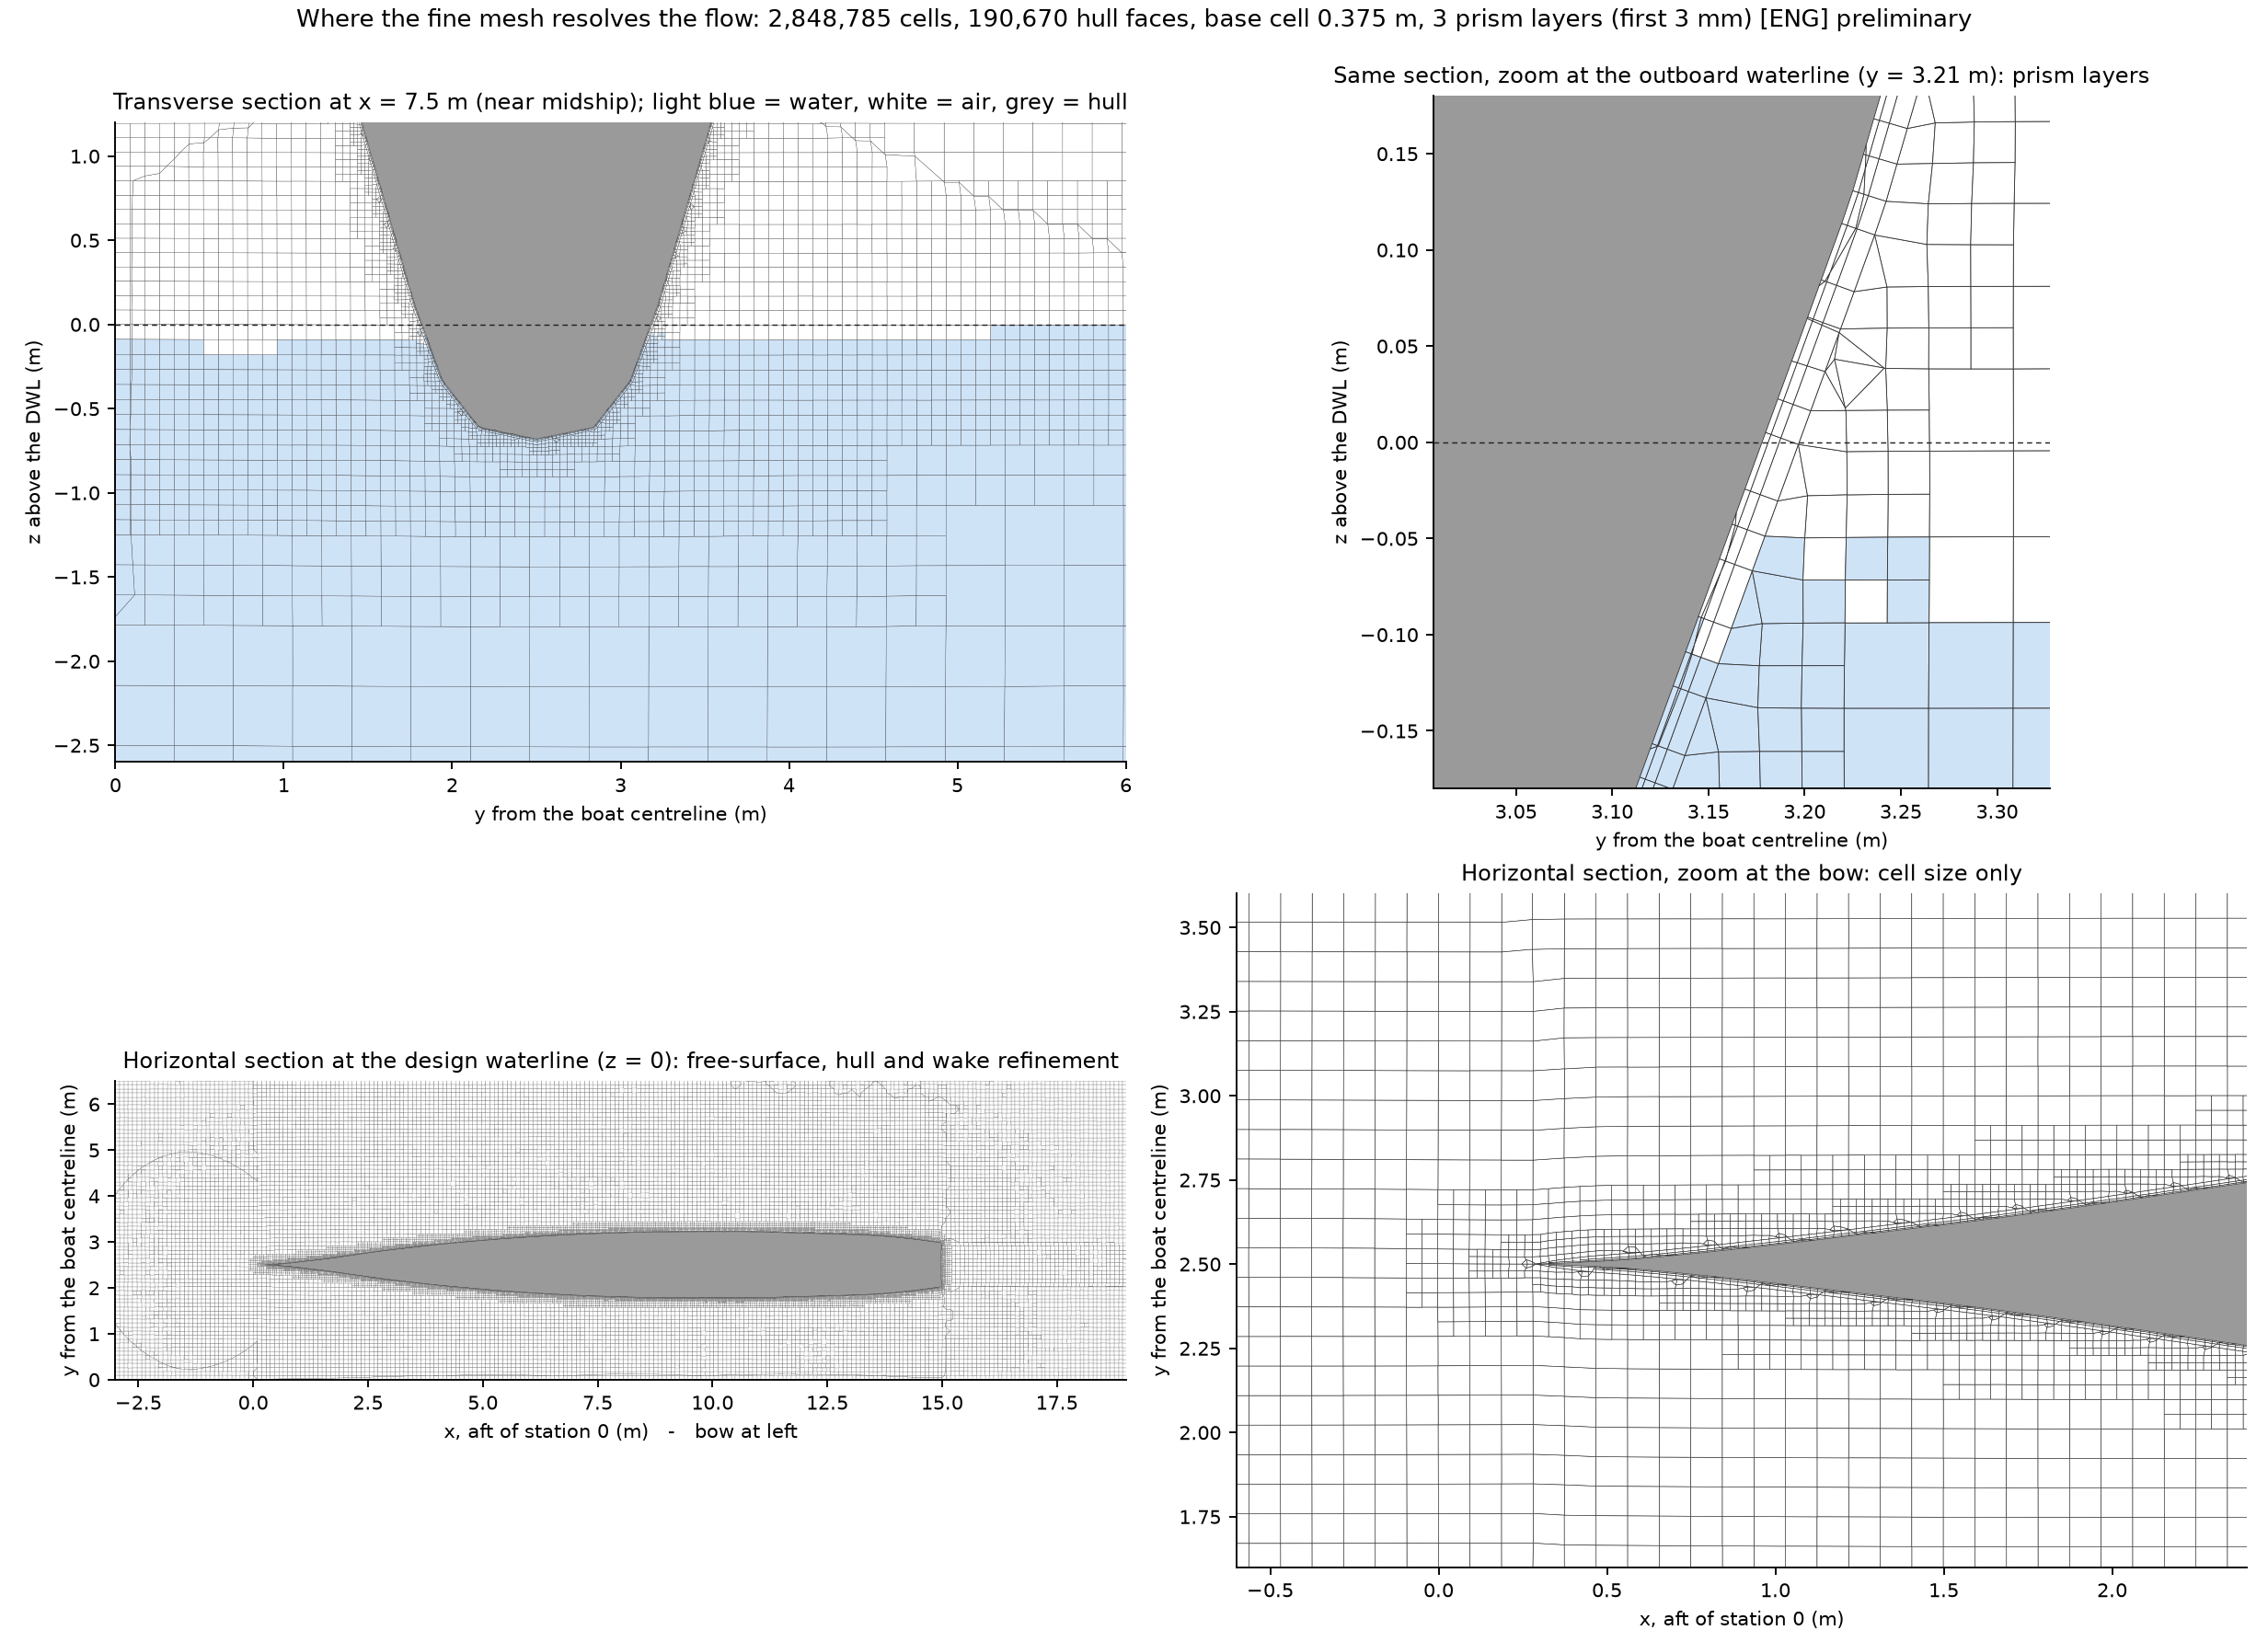
The mesh supports the calculation
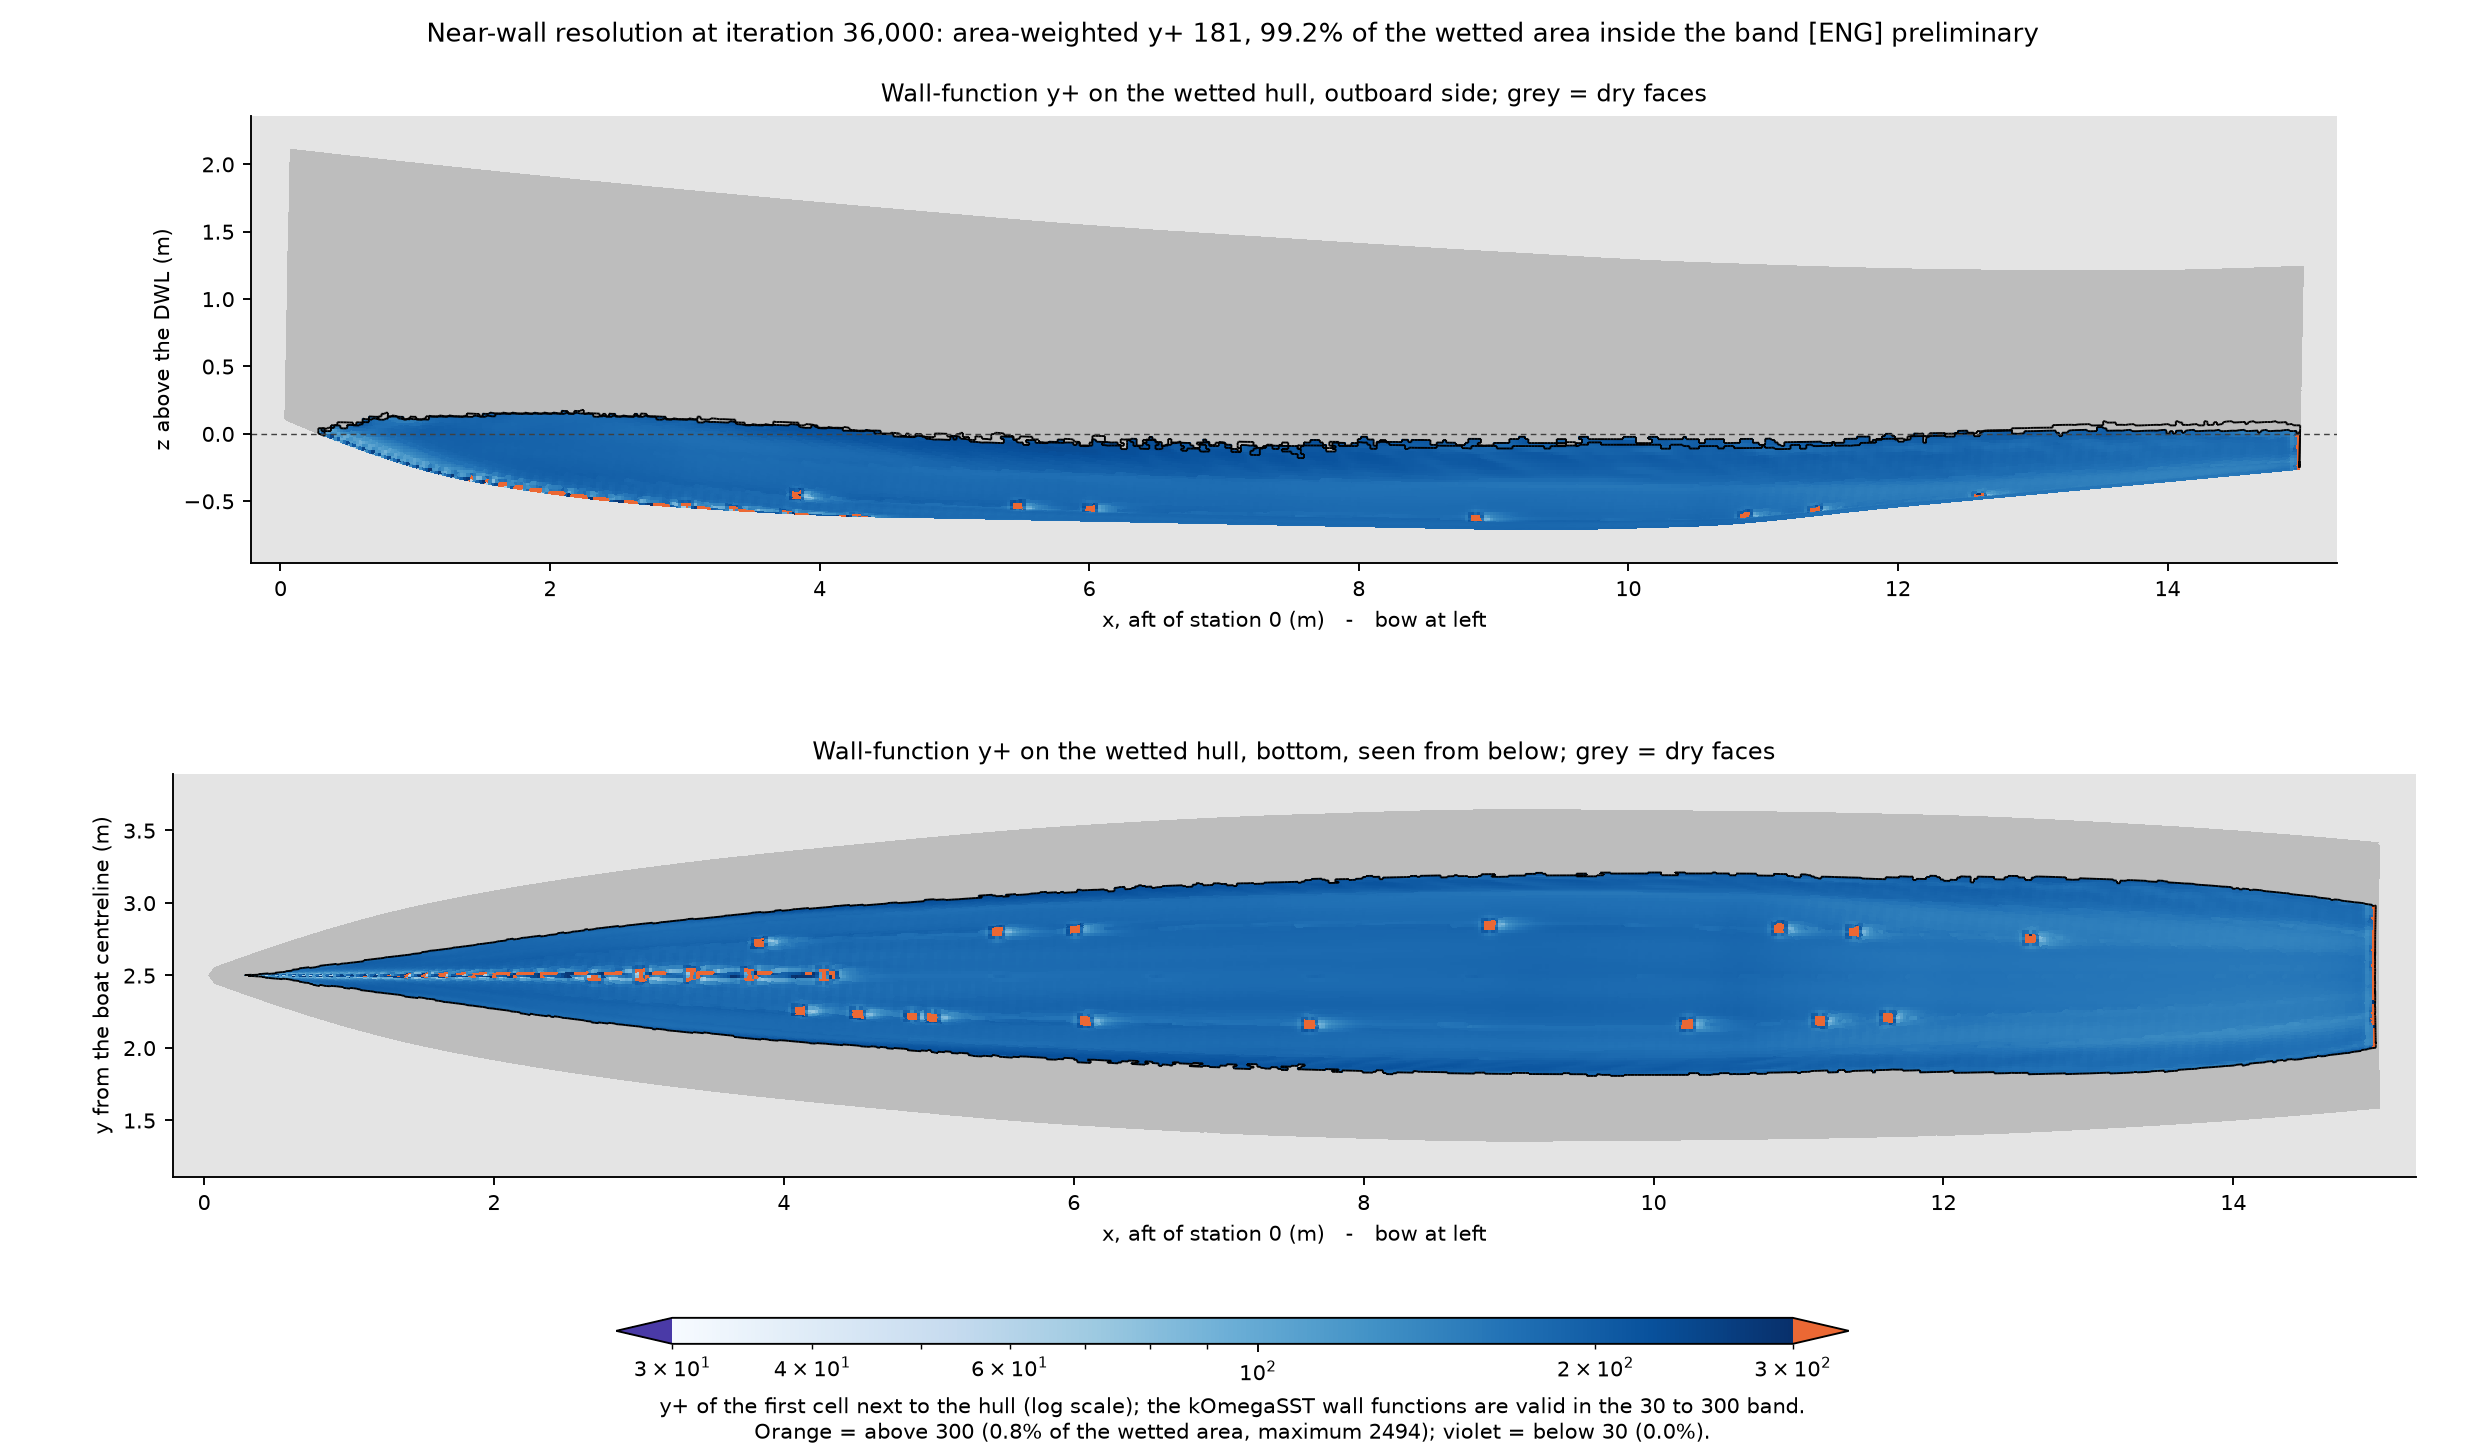
A CFD result depends on where the grid resolves the flow. This case puts small cells around the free surface, each hull, and the wake. Three prism layers follow the hull skin to support the wall-function calculation of viscous resistance.
What the case leaves out
The solver models smooth, bare hulls in calm water. It does not include:
- Hull surface roughness or fouling.
- Rudders, skegs, propellers, or shafts.
- Air drag from the hulls, bridgedeck, or house.
- Wind, waves, or the motions that waves cause.
- Propeller interaction with the hull and wake.
- A converged fine-grid attitude or a validated numerical uncertainty band.
The reported 7.90 kW is bare-hull tow power. It is not shaft power or DC bus power. Review the broader assumptions on the performance page and in the hull form study.
Reproducible record
| Item | Recorded value |
|---|---|
| Case | half_8p15kt_s5p00m_s26p8mm_t1p157deg_fine, fine-grid attitude iteration 3 |
| Condition | 12,700 kg displacement, 5.0 m hull-center spacing, 8.15 kn, calm water |
| Mesh | 2,848,785 cells, 190,670 hull faces, three prism layers, 3 mm first layer |
| Solver | OpenFOAM 14 incompressibleVoF, k-omega SST, 16 ranks |
| Field record | Iteration 36,000, written 2026-10-01 at 08:25 UTC |
| Force window | Iterations 28,800–36,000, 7,201 samples; gate passed |
| Evidence | CFD visualization packet in pull request 70, source commit f4bba2f |
The page uses the preserved SUN-85 iteration 3 fields and force history. The rendering command checks the force window against the accepted evidence record before it publishes a view. The page changes no geometry, resistance baseline, weight, vessel energy budget, or construction decision.